Why Broccoli Is Important To Financial Traders
It's nothing to do with diet. It is to do with fractal math.

Broccoli Romanesco looks like a cauliflower from outer space. It is from the same vegetable family as cauliflower and broccoli and comes from Lazio (which is right near Rome - hence the name).
But wait! Wasn't this blog supposed to be about trading? It is, just give us a little time.
Romanesco broccoli is a stunning work of art and at the same a mathematical joy. How? Well this special and gorgeous broccoli is a wondrous example of a Fibonacci fractal appearing in the in the natural world.
On a Romanesco, the whole head of broccoli is made up of smaller heads that replicate the shape of the larger head, and each of those smaller heads is made up of even smaller, self similar heads. It keeps going, and going, and going…
So in a nutshell you’re looking at a natural fractal — quite simply, a pattern that repeats itself ad infinitum. (Technically of course, since a head of broccoli can’t go on forever, math purists/geeks call this an approximate fractal, since it has a finite end point.)
The point is this. If you break off a floret, it looks like a mini broccoli with its own mini florets. Fractals are fascinating for that reason; no matter which part of the fractal you zoom in on, it will be an identical version of the bigger picture.
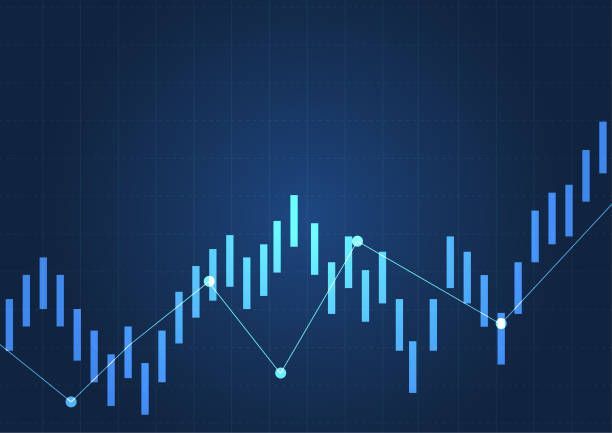
Now think about the financial markets. Look at the chart below. With no axis it is impossible to know what timeframe this chart would represent. Is it annual or weekly? 5 minute? You can't tell. But one thing is for sure, if you were to zoom into one of these candles, you would see the market didn't go straight up or down, that candle itself would have a pattern that would look at first glance, like the original.
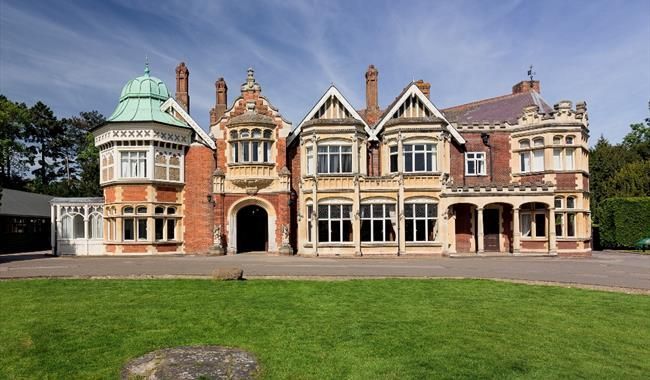
This is because financial markets are themselves fractal in nature. Just like Broccoli Romanesco the patterns repeat. In financial data, if you take enough observations of price, volume, momentum, time and elapsed time ..... fractals can be decoded. Just as the Bombe decoded the Enigma in WW2, so our math decodes patterns in the markets - enabling us to trade with remarkable accuracy and profitability.