Trading stocks - Tesla hits its target - another great profit
Stock trading - Tesla hits its short term target for another great profit
Tesla is an amazing stock to trade for the swing trader.
This was a simple trade and we followed the Inteligex trading rules to a tee.
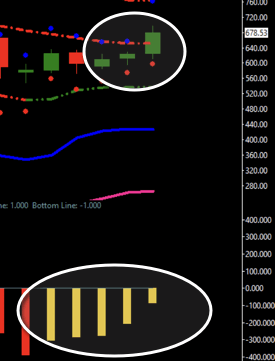
Look at the WEEKLY chart (right). Its very easy to see that we are in an up trend and have been for the past 3 weeks. Our momentum (circled at the bottom of the chart) is yellow and headed towards our zero line.
That takes about 10 seconds of your time to work out - its simple and totally visual.
What does it tell you? It tells you that on the daily chart we are looking for long trades, trades that are in the direction of the dominant weekly trade.
Sounds complex? It isn't. But now we know we are hunting longs .. the rest is even easier.

Now we shift to the DAILY chart. We look to trade here at the close price of the first signal.
The trade target (the predicted high for the trade) is circled. Tesla was trading about $617 on the close and we were predicting a rise to $655 over 4-8 days. The blue dot is the clearly indicated target.
One the 4th day we hit the target, and at this point we look to exit HALF our position. We do so. In this case, we also happen to get a second long trade signal.
We gap up open and the very quickly make the second trade target - just another $4 on the new trade but taking the second half of our first trade to a whopping $68 profit on the second half of our initial trade. Remember we were long @ $617 and closed out at $683
And there we have Tesla ... over 10% gain in five trading days. Is your fund manager doing that? Are you? Why not learn to trade stocks?
When you look at learning to trade stocks, you will read in many places a few things:
- Trade with the trend. Check. Inteligex shows you how to do this.
- Always have a stop. Check. Inteligex always suggests a maximum stop.
- Run a winning position. Check. Our money management technique shows you how to run winners.
One thing you rarely see though is anyone talk about predicting stock moves. Some say it is impossible. We say no. And we will show you how to do it on any timeframe. Become an Inteligex member and trade stocks like a pro. Learn to trade stocks with professionals.